Asking for a Report the Way You'd Say It
To see a table you first have to learn that table's language. Which field, which filter, which date range. You can't reach the data without learning the tool — which is why most people never do, and ask someone else instead.
HuMetric turns free text into measurements: a meeting note, a call recording, a customer review goes in, and a measured number comes out. Last week we moved reporting into the same place. You now write the way you'd say it.
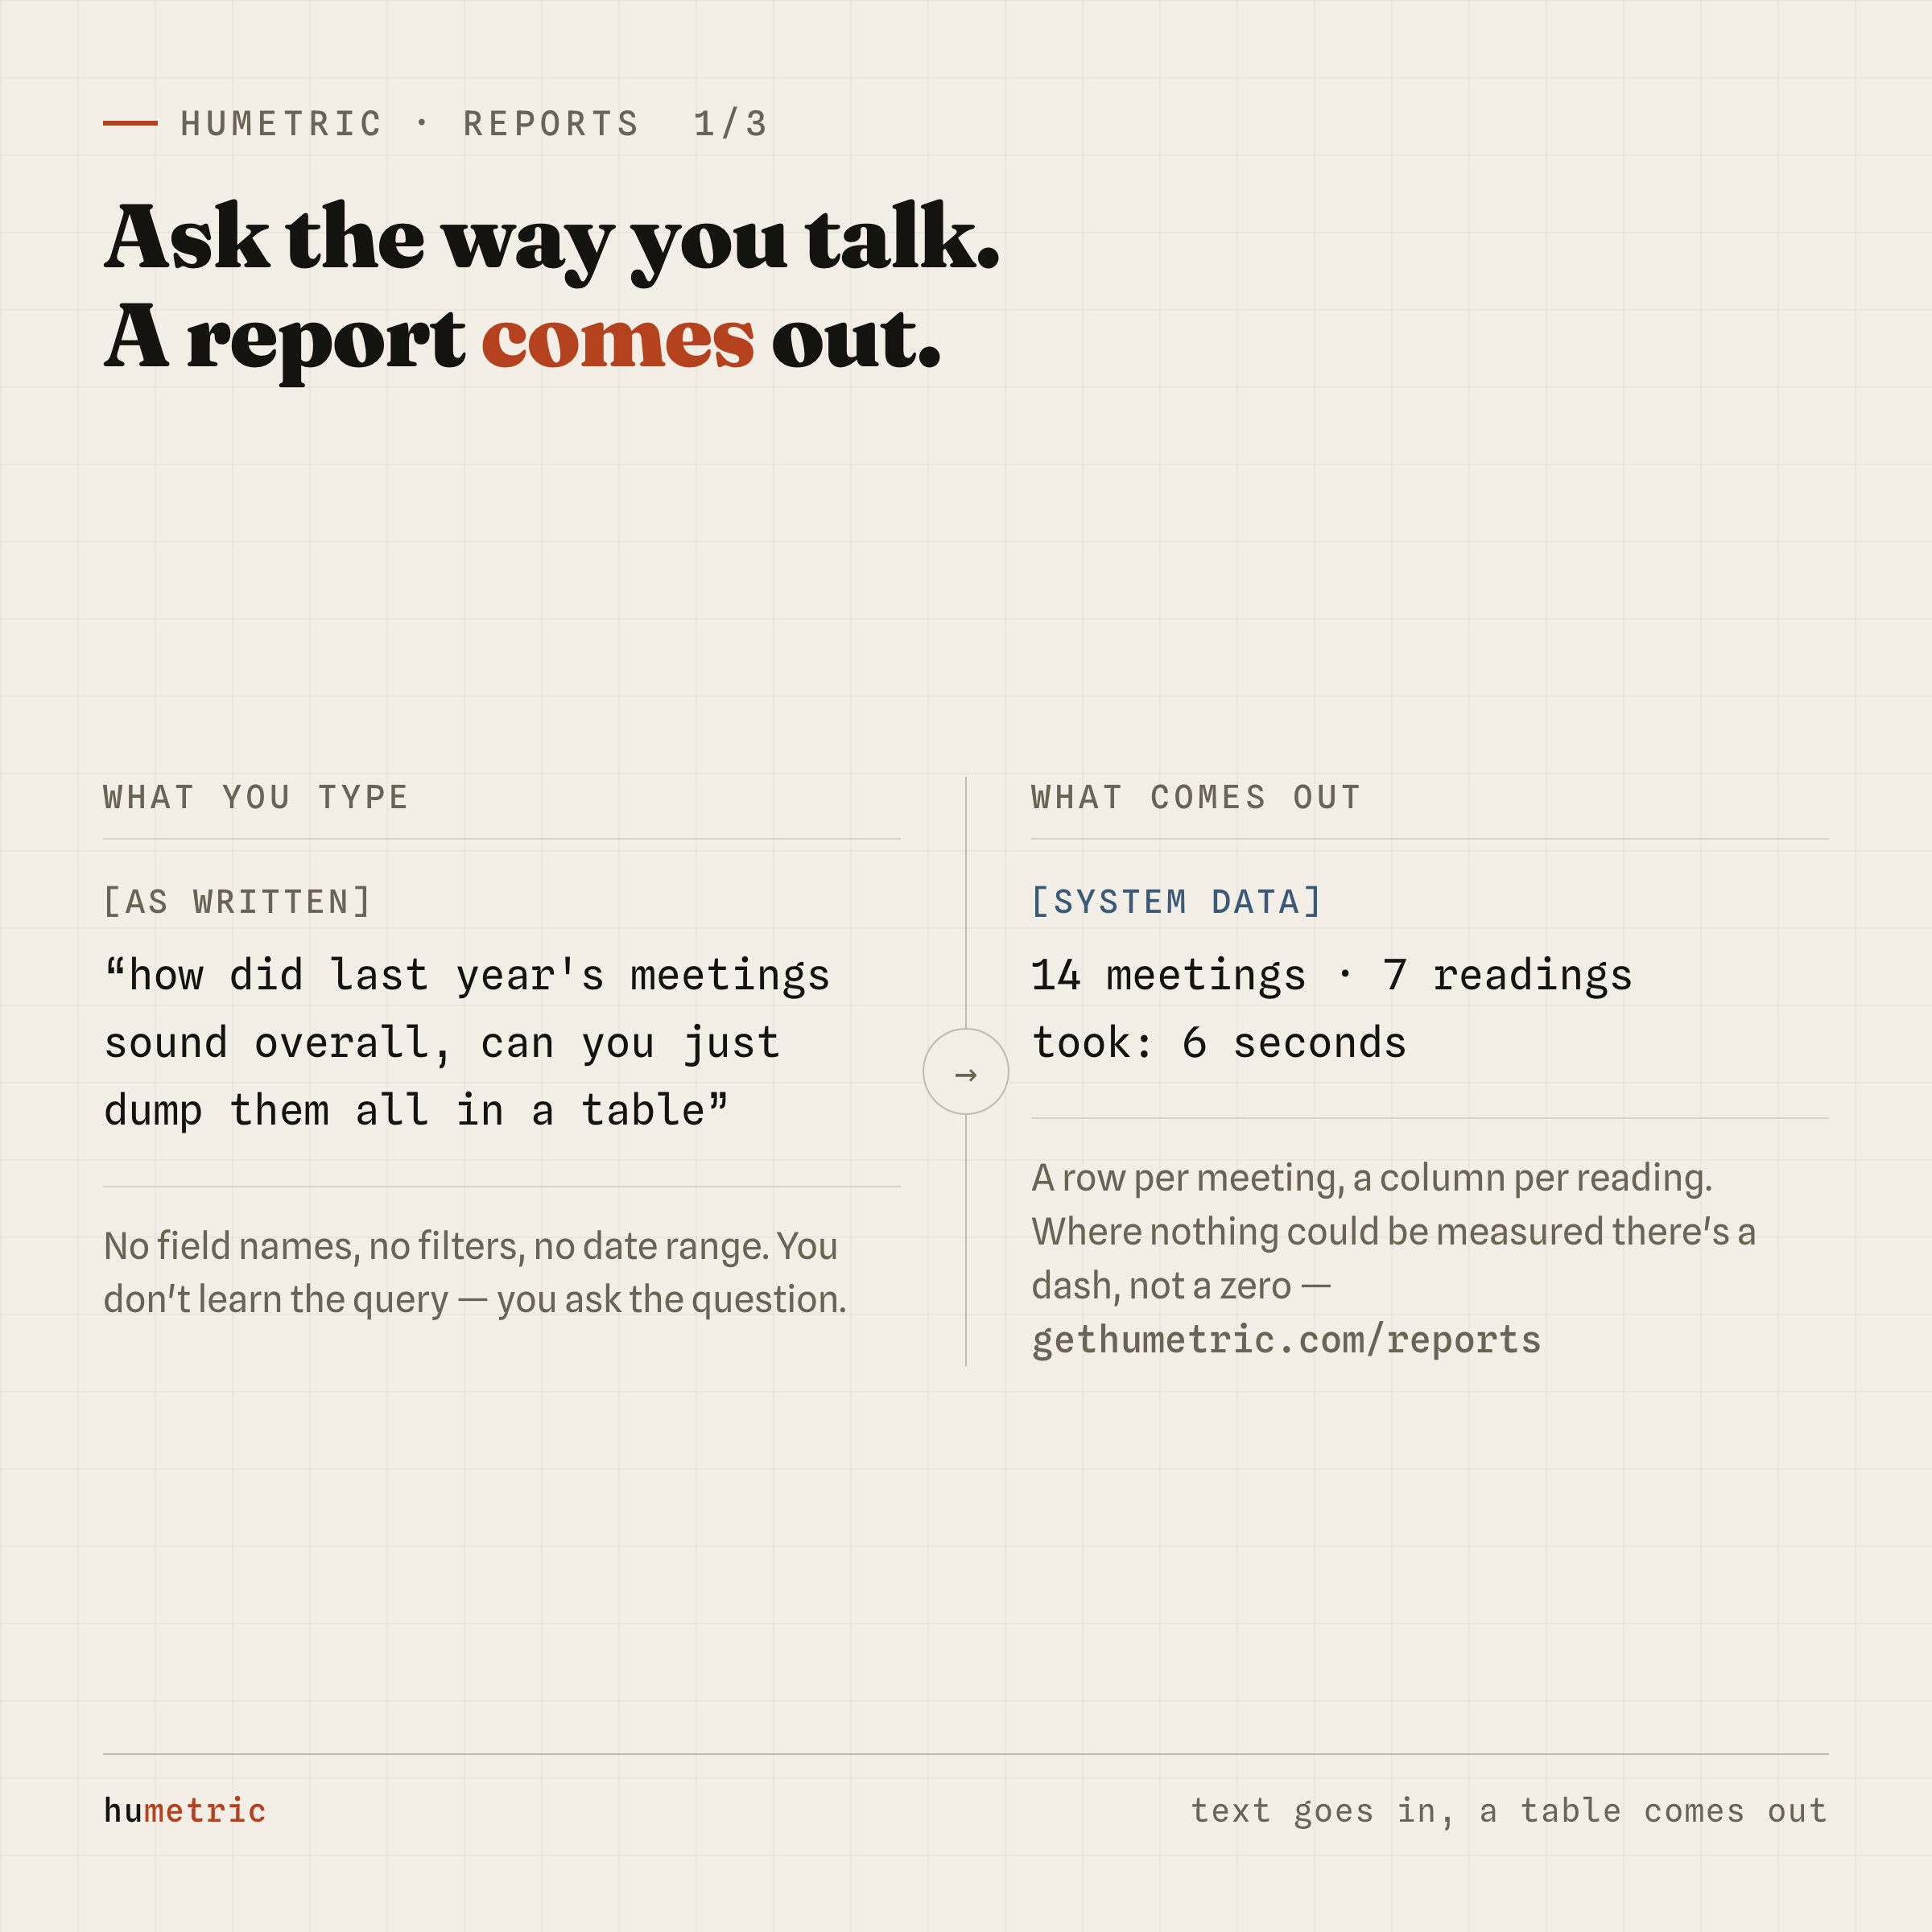
The sentence can be this messy
how did last year's meetings sound overall, can you just dump them all in a table
Six seconds later you have a page. A row per meeting, a column per reading. Where nothing could be measured there's a dash, not a zero — and the difference matters: a zero is a measurement, a dash is an absence.
There are no field names in that sentence, no filters, no date range. What you meant is worked out from the packs you already have. A "pack" here is one file describing which kind of record you track and with which readings. In the example where we processed a central bank's meeting statements, the pack defines seven readings — resolve, caution, tightening bias, and four more.
You don't need to know what to ask for
A report comes in four shapes, and which one you get is read off your sentence:
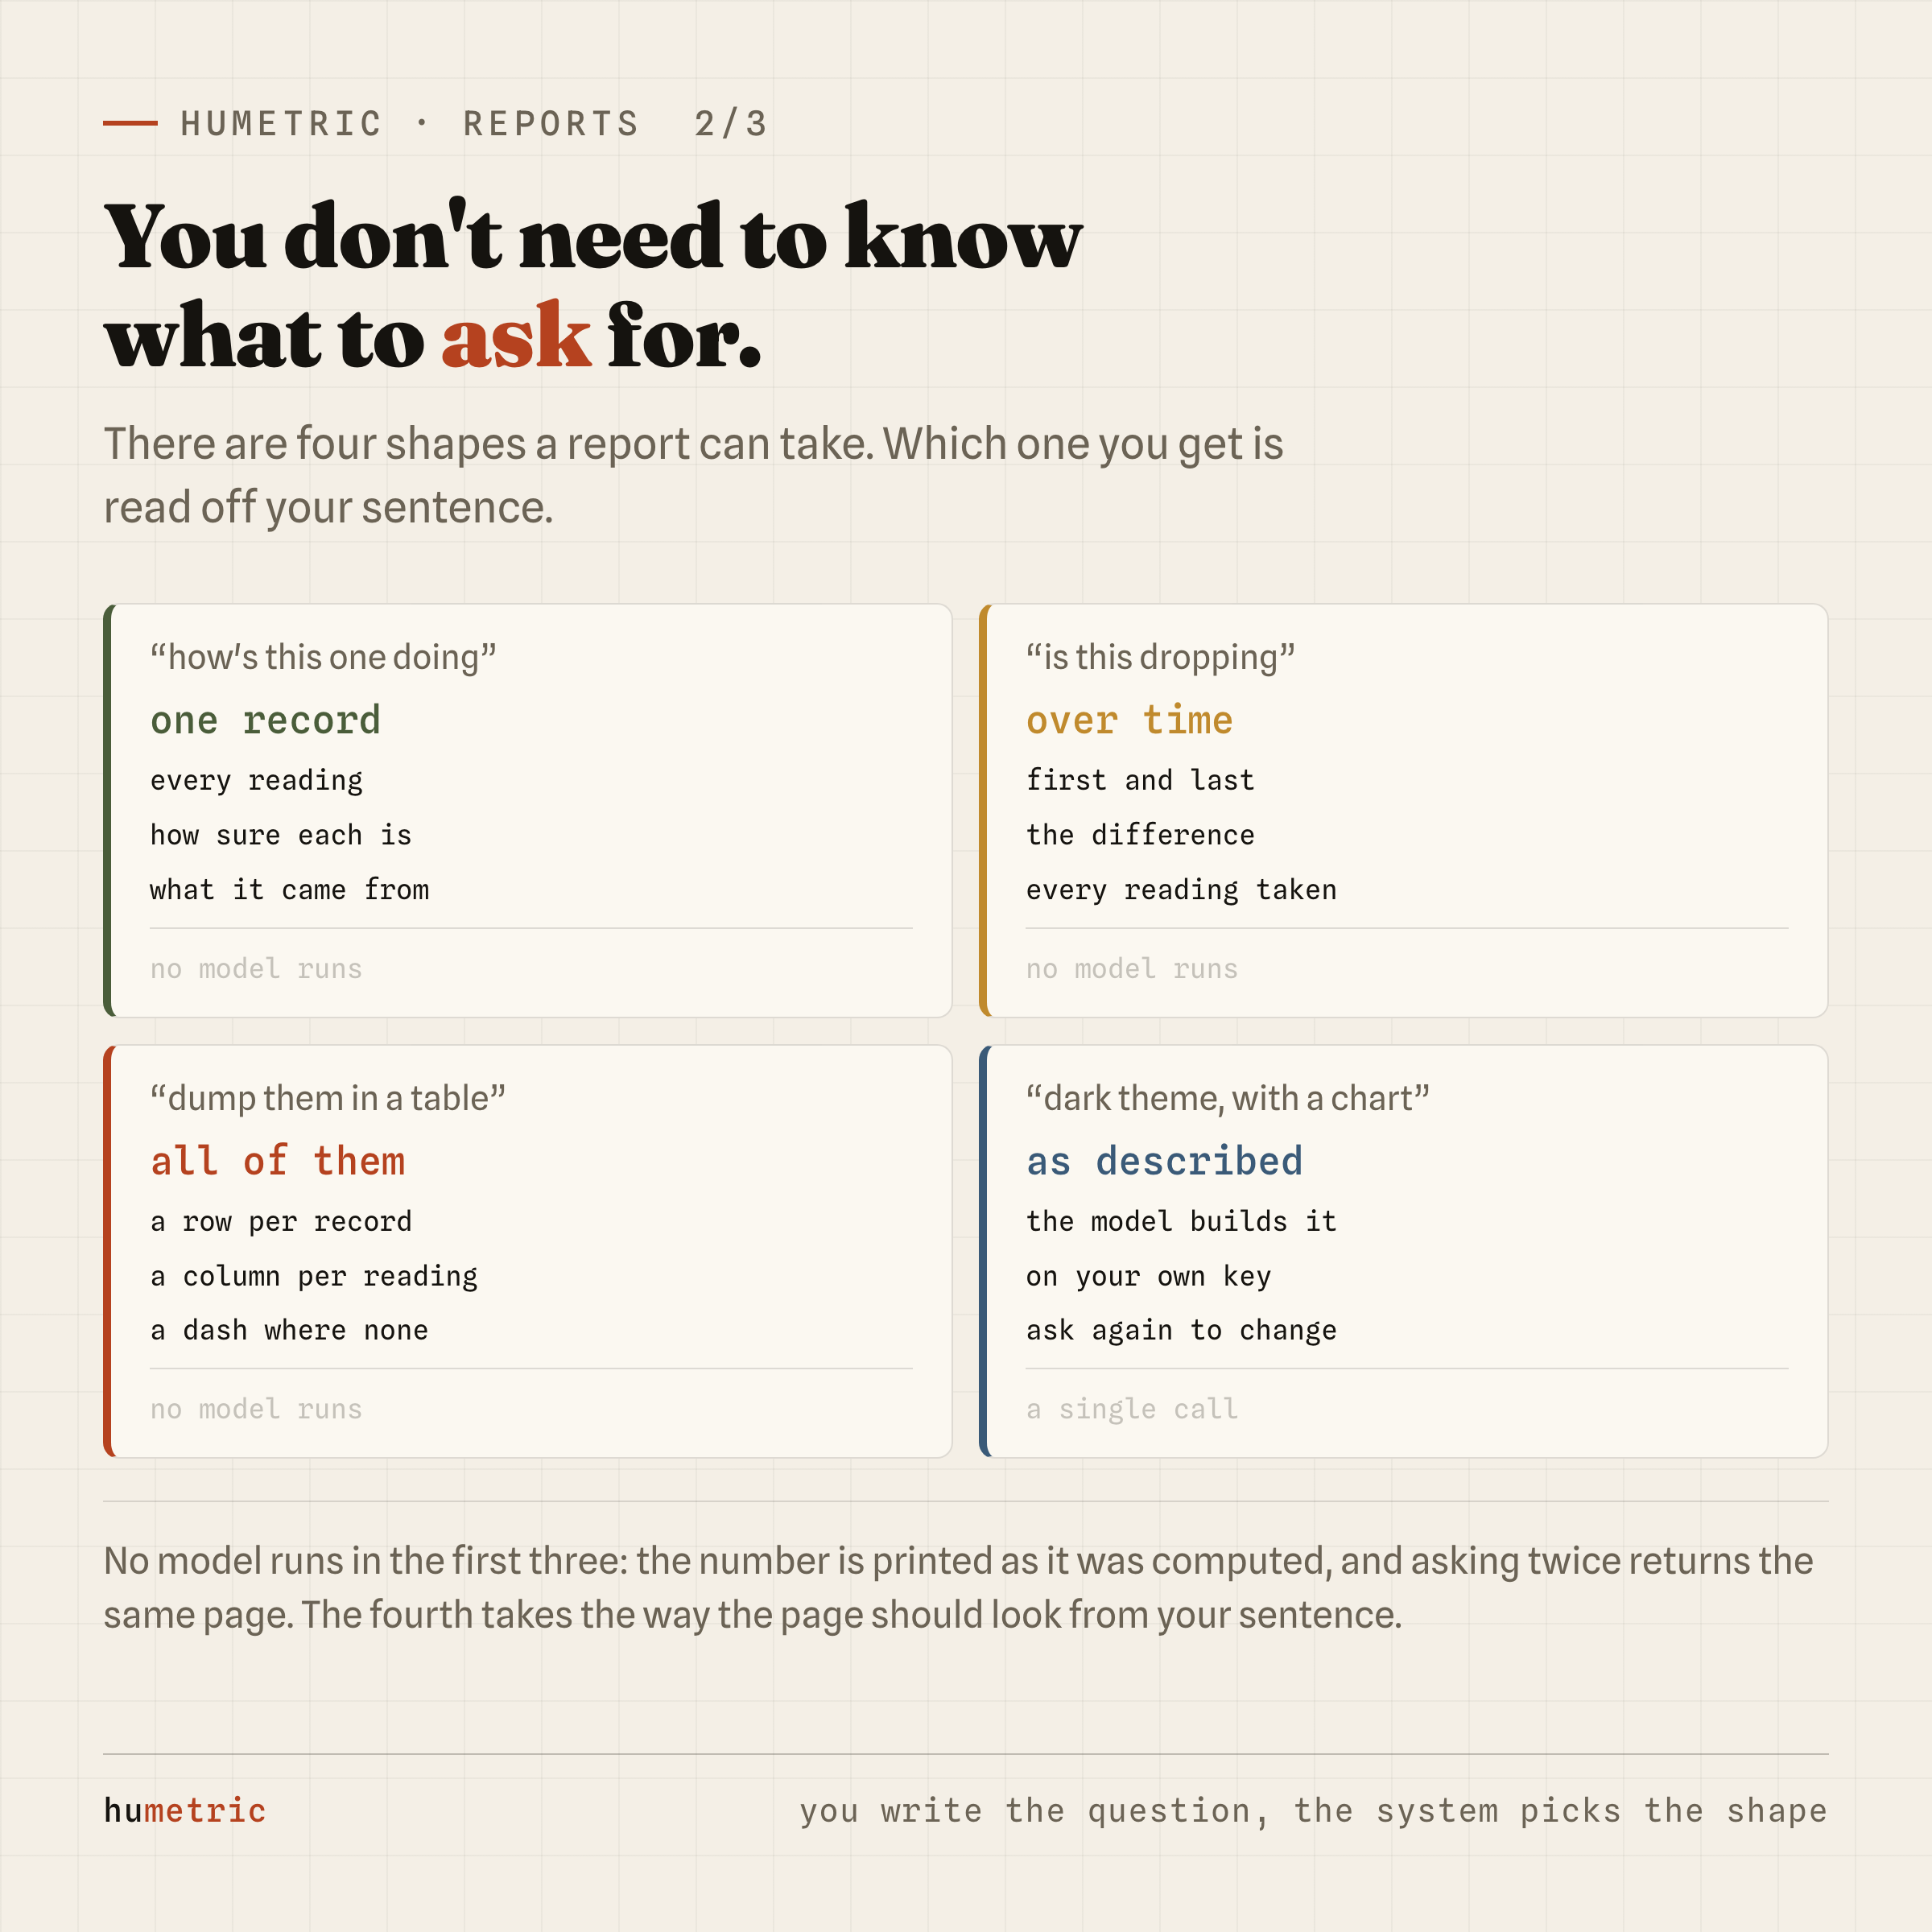
| When you say | What comes back |
|---|---|
| "how's this customer doing" | Every reading for one record, with its value, how sure it is, and how many records it came from |
| "is this one dropping" | One reading over time: first value, last value, and the difference |
| "dump them all in a table" | Every record of the same kind × every reading |
| "make it dark, with a chart" | The page you described |
No model runs in the first three. Template code builds the page: the number is printed as it was computed, and asking twice returns the same page. In an AI product that can sound odd, but the reason is plain — if a table has to come back identical twice, you can't put a model in the middle.
The fourth one: you describe the page
make it a dark page, curve on top, put the table underneath
Not one figure is in that request, and none should be. The server reads the figures out of the records and hands them to the model; the model's job is to build the page. It runs on your own provider account — Anthropic, OpenAI, Google, DeepSeek, whichever key you connected. Don't like the page? Change the sentence and ask again; there's no session to keep, no round of questions to answer.
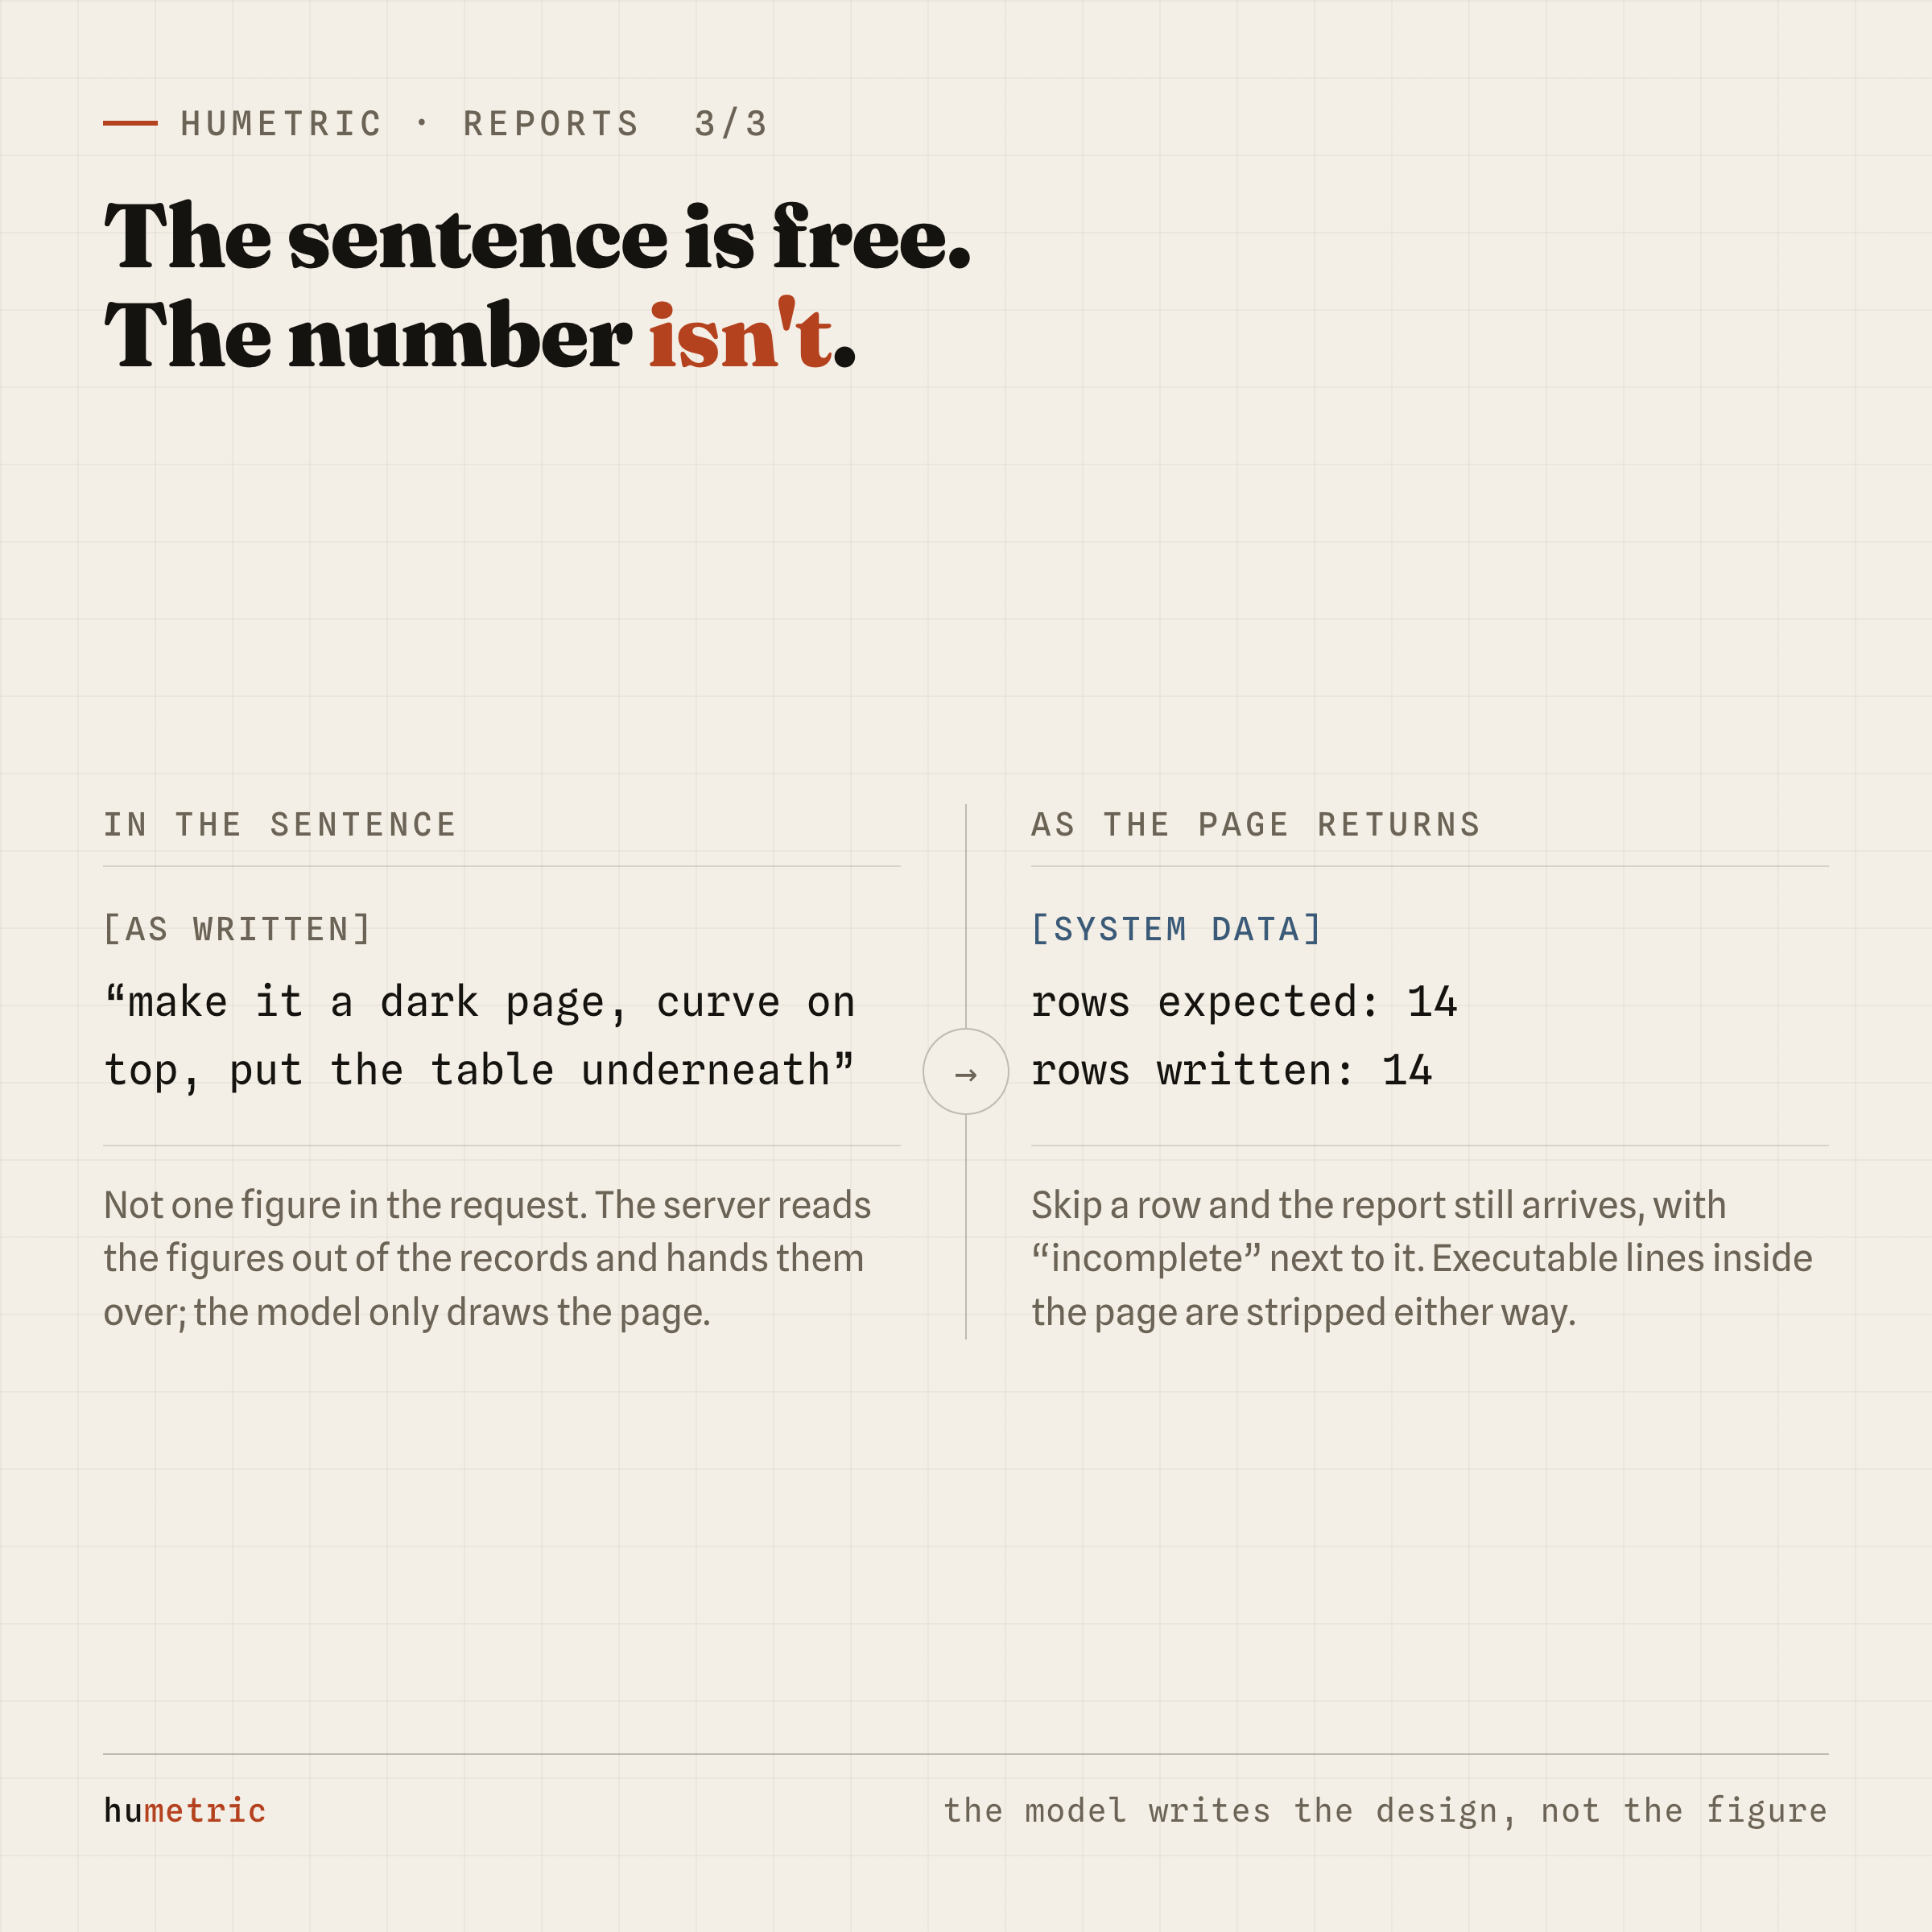
The honest part of this path: because the model writes the page, it also retypes the figures. On our first real run, 8 rows came back out of 14 records, and one row's values had been copied from the row above it. The curve we asked for wasn't drawn either — our drawing permissions had no line element, so a line the model wrote was stripped anyway.
We fixed both. The record count is now stated to the model explicitly, the rows on the returned page are counted afterwards, and if some are missing the report still arrives with "incomplete" on it. So the clean sentence is this: in the first three shapes the number is printed as computed; in the fourth the model types it, and the system counts and tells you. When the figure is critical, use one of the first three.
Nothing inside a report runs
A report is a web page, and part of its content comes from your data — in the fourth shape, from a model. Neither is a trusted source. So whichever shape produced it, every page goes through the same filter: executable lines are stripped, leaving text, tables, styling and drawing. In the panel it then opens inside an isolated frame — no access to your session, your browser storage, or other tabs.
A saved report is an address
Save the report and you get back an address you can open (/reports?doc=…).
Next time you don't rebuild the report, you open its address. That address
belongs to your account — opening it needs a sign-in.
To show the report outside your team you hand out a second address: the Share button in the panel (or telling your assistant to share the report) turns it into a link that opens without signing in. Turn it off and the link dies, but the address is kept: turn it back on and the link you already sent works again, with nothing new to distribute.
The report behind this post is shared exactly that way — anyone can open it, account or not:
Tone of Turkish central bank meetings — 14 meetings, 7 readings
Every row is one rate-setting meeting and every column one reading; a dash means that reading was never produced for that meeting.
How to connect
You introduce it to your assistant once:
claude mcp add --transport http humetric-site https://gethumetric.com/mcp \
  --header "Authorization: Bearer hms_live_..."
After that it's just sentences — the assistant decides which tool to call. Generating a report costs a flat platform fee, and the shape doesn't change it; the fee is taken before the work, so when credit is short nothing is built and nothing is charged. The model's own cost sits outside that, billed to you by your provider directly. Listing, opening and deleting saved reports is free.
Limits worth knowing
- The built-in shapes draw no charts, just tables and summary boxes. For a chart, use the fourth path.
- The full table shows at most 300 records; beyond that it's cut, and the report says so.
- 500 KB per report, 200 reports per account.
- The built-in shapes currently render in Turkish. For an English page, write the description in English.
One sentence to try it
If you already have a pack, the first try really is one sentence: ask it to dump all your records into a table. Everything you have been checking one at a time sits on a single page — and instead of building that page again, you keep its address.